300x250 AD TOP

Search This Blog

Pages

Featured Post

Stop Running Your Development Team on One LLM Provider

A CTO's Playbook for Resilient AI Coding Infrastructure Your database has redundant replicas. Your servers fail over. Your Disaster Rec...

Paling Dilihat

Powered by Blogger.

Feature Label Area

Tuesday, August 4, 2026

Stop Running Your Development Team on One LLM Provider

A CTO's Playbook for Resilient AI Coding Infrastructure

Your database has redundant replicas. Your servers fail over. Your Disaster Recovery Plan (DRP) is documented and tested. Yet your entire engineering team's productivity depends on a single vendor's infrastructure. That single point of failure (SPOF) is an architectural risk this playbook fixes.


The Market Reality: No SLA, No Recourse


When you build your development workflow on a single LLM provider, you are running a production system with no SLA, no contractual guarantee of continuity, and no meaningful recourse if you get blocked or the service goes down.

This is the market reality for every major LLM provider. It is stated plainly in their terms of service: none of them guarantee uptime, none of them offer contractual liability for service interruptions or account suspensions, and none of them commit to resolving access problems on your timeline. See all provider terms at the bottom of this article.

If you get blocked, your only option is the support portal. No SLA. No phone number. No contractual guarantee of resolution. This is standard for the AI industry - and why a multi-provider strategy is a baseline engineering requirement, not an attack on any provider.

Your database has redundant replicas. Your servers fail over. Your DRP is documented and tested. But your engineering team's entire productivity runs on a single vendor's API - with no equivalent protection. That is the problem this playbook fixes.

  • Provider Outages: Multi-hour global API outages across major providers regularly stall engineering teams - and there is no SLA to lean on when it happens. status.claude.com | status.openai.com/history | marketing4ecommerce.net | dev.to | bleepingcomputer.com
  • Government Directives: In June 2026, national security restrictions impacted non-U.S. national access to specialized cybersecurity models like Anthropic's Claude Mythos 5 and Fable 5, forcing immediate access revocations for affected enterprise user segments. anthropic.com/news/fable-mythos-access | Access was restored in July 2026 following safeguard updates. anthropic.com/news/redeploying-fable-5
  • API Deprecations: OpenAI set a hard sunset date of August 26, 2026, for the Assistants API. Building on proprietary abstractions forces periodic migration cycles where you absorb the refactoring costs. developers.openai.com | ragwalla.com
  • Account Controls & Compliance: Mass account suspensions via automated fraud detection - and enforced API key restriction policies (such as Google Cloud's June 2026 mandate requiring all Gemini API users to restrict their keys or lose access) - frequently turn third-party compliance tasks into urgent internal disruptions. discuss.ai.google.dev | cybernews.com

The pattern is structural: when you build on a proprietary API, you do not own your access. Government actions, alignment updates, security mandates, and automated flags can suspend service without warning, without compensation, and without recourse.

This is the same reason you don't run production on a single server. You have a DRP. You need one for AI coding agents too.


The Strategy: Dynamic Vendor Redundancy

The goal is not to abandon proprietary providers. The goal is to decouple developer velocity from any single API. Treat major frontier providers as structural peers with distinct capabilities, trade-offs, and failure modes:

Provider Core Strengths Technical Risk / Vulnerability Primary Role
Anthropic (Claude) Extended context handling (1M tokens), multi-file codebase reasoning, agentic tool workflows. Guardrails can trigger false positives on vulnerability testing; strict account enforcement. Refactoring complex, multi-file codebases.
OpenAI (GPT-5.5 / Codex) Native tool integrations (Cursor, GitHub Copilot), broad ecosystem adoption, GPT-5.5 at 88.7% SWE-bench Verified. Deprecation cycles for early abstractions (e.g., Assistants API to Responses API migration). High-throughput completion, green-field code generation.
Google (Gemini 3.1 Pro) Large context windows (2M+ tokens), low per-token cost, GCP integration. Context retrieval accuracy can vary across deep reasoning chains. Ingesting large repositories, full-codebase security audits.

Three Tiers of Risk Mitigation

Tier 1 - Multi-Provider Redundancy via API Access (Do This Now)

Build redundancy at the provider level, not the account level. Every major LLM provider's usage policy prohibits using a second account to circumvent a suspension - language to the effect of "circumvent a ban through the use of a different account, including the creation of a new account or use of an existing account." A backup account at the same provider is not a DRP strategy; it is itself a policy violation.

The correct architecture - multi-provider, not multi-account:

The only genuine redundancy path is distributing across separate commercial relationships:

  • Claude → commercial relationship
  • OpenAI → separate provider
  • API aggregators → OpenRouter or Fireworks AI route to DeepSeek, Kimi, Qwen, GLM, Mistral

These are separate contracts, separate billing, separate enforcement surfaces. A suspension at one channel does not affect the others.

⚖️ Why a Standby Account Is Not a DRP

Every major LLM provider's usage policy prohibits routing around a suspension via a different account. Your only stated recourse is the support portal - no SLA, no phone number, no contractual guarantee of resolution. This is why the only valid DRP strategy is distributing across separate commercial relationships, not maintaining backup accounts at the same provider. See all provider terms at the bottom of this article.

Tier 2 - Multi-Engine Developer Training (This Quarter)

Train engineering teams across at least two agentic paradigms (e.g., Claude Code with Opus 5, Cursor with GPT-5.6 Sol, and Cline/OpenCode with open-weight models such as Kimi K3, Kimi K2.6, or MiniMax M3). Cross-training ensures an outage in one primary tool does not stop active development.

A note on harness adaptation vs. vendor lock-in: the goal is not to claim that switching between Claude Code, Cursor, Codex, and open-weight models is seamless. It isn't. Each has distinct system prompts, tool-use schemas, and context-retrieval patterns. A developer trained on Claude Code will need time to adapt to Cursor - and vice versa.

But there is a meaningful difference between two things that get conflated:

  • Single-source reliance - building your entire workflow on one provider with no exit path. This is the architectural risk this playbook addresses.
  • Harness friction - the learning curve of switching between different coding agents. Real, but bounded.

Most user flows can be served by more than one model. Most development flows can be served by multiple agentic coding tools. A developer who understands the principles of software development - context management, task decomposition, commit hygiene, testing - can work across any of these tools. The principles remain the same. What varies is the interface.

The real risk is not vendor lock-in per se; it is process-dependence - relying on the harness to compensate for weak development discipline. A developer who relies on the harness to do its job will struggle to adapt regardless of which provider they use. A developer who understands the process will find that fluency transfers.

SWE-bench is the standard benchmark for measuring coding agent performance against real GitHub issues. As of August 2026, the benchmark landscape has split into two distinct tiers - and understanding which one you are reading matters:

SWE-bench Verified (500 curated Python issues, near-saturation): Top frontier models cluster tightly at 95.0%–97.0%. Meaningful performance separation has moved elsewhere.

SWE-bench Pro (1,865 enterprise tasks, long-horizon, harder): This is where the real differentiation happens. The same models that score 96%+ on Verified resolve between 62% and 80% on Pro.

The scaffold gap - why numbers look contradictory: Model scores are heavily dependent on the testing harness. On Scale AI's standardized mini-swe-agent harness, top models reach 59.1% (GPT-5.4) to 61.5% (Muse Spark 1.1). Inside custom vendor frameworks (e.g., Claude Code CLI), identical models gain a 15–30 point boost. This is why you see GPT-5.5 reported at both 58.6% and 88.7% - they are measuring different things on different harnesses.

The numbers to know (August 2026): (Benchmark scores are scaffold-dependent - only compare within the same harness column)

Model Price (per 1M tokens) SWE-bench Verified SWE-bench Pro (Vendor Scaffold) Notes
Claude Opus 5 $5.00 / $25.00 96.0% 79.2% Anthropic flagship; no data retention; automatic safety fallback routing [anthropic.com] [datacamp.com] [morphllm.com]
Claude Fable 5 $10.00 / $50.00 95.0% 80.3% Cybersecurity-specialized; leads Pro; Terminal-Bench 2.1: 88.0% [benchlm.ai] [datacamp.com]
GPT-5.6 Sol $5.00 / $30.00 96.2% 64.6% OpenAI flagship; 91.9% on Terminal-Bench 2.0 [openrouter.ai] [morphllm.com]
Kimi K3 $3.00 / $15.00 (cached $0.30) 93.4% - Open weights on HuggingFace; top Verified [benchlm.ai] [openrouter.ai]
Gemini 3.1 Pro $2.00 / $12.00 80.6% 76.2% Strong 1M+ context repository ingest [scale.com] [aipricing.guru]
MiniMax M3 $0.30 / $1.20 (cached $0.06) 80.5% 59.0% Open-weight; multimodal; 1M context [openrouter.ai] [benchlm.ai]
Claude Sonnet 5 $2–3 / $10–15 - 63.2% Default Claude Code agent; automatic safety fallback routing [benchlm.ai] [morphllm.com] [datacamp.com]
GLM-5.2 $1.40 / $4.40 - 62.1% Beats GPT-5.5 (58.6%) on Pro; MIT licensed [benchlm.ai] [requesty.ai]
Kimi K2.6 $0.95 / $4.00 80.2% 58.6% Open weights; Agent Swarm; multimodal [openrouter.ai] [benchlm.ai]
GPT-5.5 $5.00 / $30.00 - 58.6% Mid-tier on Pro despite Verified history [benchlm.ai] [inworld.ai]
Kimi K2.5 $0.60 / $3.00 - 50.7% Cost-effective open-weight baseline [benchlm.ai] [microsoft.com]

The real-world PR acceptance rate for top coding agents is 35–50% - not because the models fail, but because real codebases have conventions, reviewer expectations, and implicit context that benchmarks miss.

The most important finding from SWE-bench analysis: "Same model, different harness, swing of 15–20 points." codesota.com The agentic loop architecture, retry policies, retrieval strategies, and codebase context handling swing scores more than which frontier model you chose. A developer proficient with Claude Code's tool use and a developer proficient with Cursor's parallel agent system are producing meaningfully different outcomes - not because of model quality, but because of how well they orchestrate the tool. presenc.ai

The practical implication: Once you are using a frontier-tier model, the differences between top providers are small enough that switching costs are low. What makes a developer productive with a coding agent is knowing the tool - how it retrieves context, when it iterates vs. when it asks for help, how to structure multi-file tasks. That knowledge transfers across providers. Train for tool fluency, not model loyalty. requesty.ai

What the benchmark numbers show-and don't show: On basic issue-resolution benchmarks like SWE-bench Verified, score gaps between frontier models appear modest because tasks are tightly bounded, as analyzed in Morph LLM's 2026 evaluation report. The real performance split occurs on harder, contamination-resistant evaluations like SWE-bench Pro, where success requires resolving ambiguous specifications, navigating large cross-file dependencies, and executing unscripted self-correction loops, as highlighted in Scale AI Labs' benchmark documentation. For routine, single-file development tasks-implementing straightforward functions, fixing explicit bugs, or writing unit tests-frontier model capabilities remain largely interchangeable, as demonstrated by Blaxel's engineering benchmark analysis.

Cross-training is a matter of developer onboarding and documented runbooks - not proprietary technical knowledge. Maintaining Claude + OpenAI + Cursor + Fireworks AI accounts is billing and seat management, not specialized engineering overhead. The cost of not doing it is engineers sitting idle during vendor outages.

Tier 3 - Managed Open-Weight Failovers (Strategic Architecture)

Deploy open-weight models as operational fallbacks. Specialized models deliver strong agentic coding performance without locking you into proprietary API uptime. This is the disaster recovery layer that makes every other tier work.


Open Weights: Mitigating Exposure Risks via US Managed Providers

A common misconception is that using Chinese open-weight models (Kimi, Minimax, DeepSeek, Qwen) forces a choice between data privacy risks and expensive local hardware. Hosting open-weight models through managed US inference providers eliminates this tradeoff.

The Managed Provider Path

Platforms like Fireworks AI serve Chinese open-weight models directly from US/EU data centers under US jurisdiction. This is the key architectural point: the model weights may originate from a foreign lab, but inference runs entirely within your legal and geographic jurisdiction - meaning zero data leaves the US/EU pipeline, regardless of weight origin.

Key benefits for enterprise stacks:

  1. Zero Direct Foreign Server Exposure: Corporate code never touches overseas infrastructure or foreign networks. Inference runs on US/EU cloud infrastructure inside SOC2 Type II compliant environments with Zero Data Retention (ZDR) policies. inworld.ai
  2. Cost-Effective Scaling Without Hardware Outlays: Self-hosting an 8×H100 GPU cluster requires $300,000+ in hardware, plus cooling, maintenance, and orchestration overhead. Managed providers host these models with hardware-optimized tensor parallelism and speculative decoding - fast inference at a fraction of the cost, with no upfront capital expenditure.
  3. Enterprise-Safe Permissive Licensing: Models like DeepSeek (MIT licensed) and Qwen (Apache 2.0 licensed) carry open commercial licenses. Running them on US managed infrastructure provides a compliant, low-latency disaster-recovery path that keeps code within approved security perimeters.

The Open-Weight Coding Model Landscape

Every competitive open-weight coding model at the agentic tier comes from an open-weights laboratory. Key models to consider for your fallback architecture:

Model Price (per 1M tokens) License Verified Pro Primary Use Case
Kimi K3 $3.00 / $15.00 Modified MIT 93.4% - Strongest open-weight on Verified; open weights on HuggingFace [benchlm.ai] [openrouter.ai]
Kimi K2.6 $0.95 / $4.00 Modified MIT 80.2% 58.6% Agent Swarm; multimodal 1T MoE; UI/UX generation [openrouter.ai] [benchlm.ai]
MiniMax M3 $0.30 / $1.20 Open 80.5% 59.0% Open-weight; multimodal; 1M context window [openrouter.ai] [benchlm.ai]
GLM-5.2 $1.40 / $4.40 MIT - 62.1% Beats GPT-5.5 on Pro; MIT licensed; self-host option [benchlm.ai] [requesty.ai]
DeepSeek-v4-Pro / V4-Flash - MIT - - Terminal Bench 2.1: 82.7 - fast agentic terminal tasks [openrouter.ai]
Qwen3 235B - Apache 2.0 - - Aider: 59.6% - broad commercial usage, no MAU caps [aider.chat]
Qwen 3.6-35B-A3B - Apache 2.0 - - Runs on single RTX 5090 - best air-gapped local option [nvidia.com]
Mistral Large 3 / Medium 3.5 - Modified MIT 77.6% - Best non-Chinese option; EU jurisdiction compliance [mistral.ai]

For teams that cannot use Chinese-origin models: Mistral Large 3 / Medium 3.5 (French, EU jurisdiction) is the leading non-Chinese option with competitive coding capability (SWE-bench Verified 77.6%). Accept that it represents a distinct trade-off in architectural sizing versus frontier MoE models.

For teams that can use open weights: DeepSeek-v4-Pro / V4-Flash via Fireworks AI is the strongest disaster recovery path you can build - benchmark-validated, US-hosted, with zero data leaving your approved security perimeter.


The Risk Balance: Comparing Deployment Models

Risk Factor US Proprietary APIs Chinese Proprietary APIs Open-Weight via US Managed Provider (Fireworks AI) Open-Weight (Self-Hosted)
Provider Access Revocation Moderate (documented suspensions) High (regulatory blocks) Low (switch providers seamlessly) None (your hardware)
Data Sovereignty / Privacy Enforced via Enterprise SLA High risk (overseas endpoints) High (US SOC2 infrastructure, ZDR) Complete control
Upfront Infrastructure Cost Low (pay-per-token) Low (pay-per-token) Low (pay-per-token) High ($300K+ GPU cluster)
Model Weight Alignment Proprietary (non-auditable) Proprietary (non-auditable) Open weights (auditable, tunable) Open weights (auditable, tunable)

The Asymmetry Worth Knowing

Open-weight models derived from foreign labs have one documented risk: political alignment triggers can occasionally degrade code quality on sensitive non-technical topics. Because you host the weights (or route via a US provider), data leakage is eliminated, but output behavior remains baked into the weights.

Conversely, American proprietary models carry their own documented trade-offs: safety alignment measurably impacts specific security research and vulnerability analysis workflows (e.g., automated patch compilation degradation in strict safety modes).

With open weights, you can audit the model, observe performance gaps, and fine-tune them out. With proprietary models, you cannot fix or audit the weights. Open weights win on auditability.


Important Considerations: The Real Costs of Multi-Provider Redundancy

Before implementing this playbook, be aware of the genuine operational realities:

Harness adaptation overhead is real. Switching between Claude Code, Cursor, Codex, and open-weight tools requires developer training and runbook maintenance. This is not a one-time setup cost - it is ongoing operational work. Build it into estimates accordingly.

The "operational tax" of multi-provider is bounded. Maintaining multiple provider accounts (Claude, OpenAI, Fireworks AI, OpenRouter) is primarily billing and seat management - not specialized technical knowledge. The overhead is real but it is not the same class of complexity as operating your own infrastructure. A CTO entering this should not expect free insurance, but they should not expect the same overhead as running a separate production system either.

What transfers across providers - and what doesn't: Rules, skills, commands, and workflows are largely portable. A context management rule, a commit hygiene walkthrough, or a code review prompt can be configured to work across Claude Code, Cursor, and open-weight tools with minor adjustments - most tools look at the same underlying instruction structures. The main caveat: identical instructions can trigger subtly different behavior depending on each tool's training data and tool-use patterns. For example, a rule that works well in Claude Code may need a one-line adjustment for Cursor's parallel agent model. This is a configuration difference, not a rewrite - but it is real and should be factored into cross-training estimates.

Runbooks decay on 60-day cycles. Provider deprecation timelines are fast. A runbook created today may reference an API that changes or sunsets within two months. Schedule quarterly reviews of your failover documentation, not just annual ones.

Benchmark tables stale quickly. The performance numbers in this article reflect August 2026 benchmarks. Model rankings shift rapidly. For ongoing evaluation, use programmatic benchmark frameworks rather than static comparisons - reference sites like SWE-bench leaderboards, Aider benchmarks, and BenchLM for current data.

Cost-per-token dynamics are shifting. Specialized hardware (NVIDIA Blackwell, custom silicon) is changing inference economics in ways that will make today's token prices obsolete within 12–18 months. Plan for a pricing review cycle, not a fixed cost model.

The right architectural abstraction is an API gateway. Rather than hardcoding specific provider endpoints into your tooling, build an abstraction layer that routes requests based on availability, cost, and performance signals. This makes provider swaps a configuration change, not a code change - and is the approach that handles all of the above concerns gracefully.

The contract landscape: Every major LLM provider disclaims liability for service interruptions in their terms of service. None offer an uptime SLA on standard agreements, and liability caps are typically capped at fees paid in the previous 12 months. This is standard for the AI industry and is not unique to any single provider. It is the reason multi-provider redundancy is a baseline engineering requirement. See all provider terms at the bottom of this article.

On seats vs. API access: Claude Code running on claude.ai seats has no SLA unless you have a signed Enterprise agreement. API access via Bedrock or Foundry is a separate commercial relationship with different terms. If your team runs on seats only, you have no contractual recourse for outages or suspensions - only the support portal and written notice channels.

Bottom line: The risk of single-provider dependency is real and documented. The cost of multi-provider redundancy is also real. The answer is not to avoid redundancy - it's to build it with the right abstraction layer and distribute across genuine separate commercial relationships.


CTO Action Plan

Week 1: Establish Multi-Provider Redundancy

  • [ ] Set up Claude via a second commercial channel - If you're using claude.ai seats, also provision Claude API access via AWS Bedrock, Google Cloud Vertex AI, or Microsoft Foundry. These are separate contracts, separate billing, separate enforcement surfaces.
  • [ ] Add OpenAI API access - Separate provider entirely. Set up Cursor or Codex CLI as a fallback coding environment.
  • [ ] Add provider aggregation - Set up a Fireworks AI or OpenRouter account for open-weight fallbacks (DeepSeek, Kimi, GLM, Mistral). One API key, many models.
  • [ ] Create a 1-page failover runbook - Document which provider to route to if your primary goes down. Practice the switch once.

Quarter 1: Integrate Fallback Pipelines

  • [ ] Cross-train development teams - Ensure developers maintain muscle memory across at least two AI agent environments. Single-tool dependency is an operational risk.
  • [ ] Run scheduled failover drills - Test infrastructure resilience by switching a development team to an open-weight fallback for a single sprint day to fix operational friction.
  • [ ] Review account compliance posture - Audit usage against vendor terms of service to avoid automated suspension triggers.

Year 1: Strategic Architecture

  • [ ] Evaluate self-hosting - If AI coding is mission-critical, dedicated hardware running open-weight models provides total independence for large engineering orgs.
  • [ ] Budget for fine-tuning - Factor in a fine-tuning pipeline if you plan to adapt open-weight models to custom enterprise codebases.
  • [ ] Build automatic routing - Implement an API gateway abstraction layer that routes requests based on availability, cost, and performance signals. This makes provider changes a configuration change, not a code change, and handles deprecation cycles gracefully.

The Goal: A Short Break, Not a Full Stop

Redundancy is not a luxury. It is the minimum standard for running production systems.

Database disaster recovery strategies focus on continuous operations despite individual system failures. The same approach applies to AI development tools: when a primary provider experiences an outage, your build pipeline should route to a secondary engine without halting development.

You would not run your production database on a single server with no replica and no backup - and claim that because the primary has been up for six months, it will always be up. That is exactly the position most engineering teams are in with their LLM provider today.

Every major LLM provider's terms of service prohibit using a second account to route around a suspension. Their stated recourse for access problems is the support portal - no SLA, no phone number, no contractual guarantee of resolution. This is the market reality. A multi-provider strategy is the equivalent of your database replica: it keeps you running when the primary fails.

See all provider terms at the bottom of this article.

The Developer Analogy: Think of a provider outage like code compiling - a brief, predictable pause while your stack shifts to a fallback, not a company-wide work stoppage.

Build the fallback. Document the runbook. Test it quarterly. This is not a best practice - it is the minimum standard for a production engineering organization.


Quick Reference: Provider Accounts to Open Today

Provider / Channel Account Type Primary Use Case Setup Time
Anthropic (API) API account Claude via API - separate from claude.ai seats; links under parent org 30 min
Anthropic (AWS Bedrock) AWS account Claude via Bedrock - separate commercial relationship 30 min
Anthropic (Google Cloud) GCP account Claude via Vertex AI - separate commercial relationship 30 min
Anthropic (Microsoft Foundry) Azure account Claude via Foundry - separate commercial relationship 30 min
OpenAI Team Account (Cursor or API) Fallback coding agent - different provider, different enforcement surface 30 min
Fireworks AI Individual / Enterprise Account Open-weight fallback (DeepSeek, Kimi, GLM, Mistral) via US managed infra 20 min
OpenRouter Individual Account Multi-model aggregator - routes to open-weight models on demand 20 min
Mistral La Plateforme Account EU-jurisdiction non-Chinese fallback 20 min

Sources & References

Disclosure: AI tools were used to assist in writing, structuring, and editing this content under human supervision and editorial review.

Tags:

Friday, May 29, 2026

Stop Dumping Logs Into Chat! The Sequential Log Analysis Protocol (SLAP)

Introduction

In the era of large language models boasting massive context windows, developers have fallen into a dangerous debugging pattern: dropping a 10,000-line raw execution log directly into a chat window alongside their source code.

Once an error gets into a chat's memory, that memory becomes less and less useful.

Sometimes a model can correct itself, but more often, it triggers a kind of "context rot"-wasting both time and tokens. The chat doesn't break down just because it's too long; it breaks down because it gets filled with its own contradictions.

When you dump a massive log into a chat, the session collapses for two main reasons:

  • It argues with itself: The model gets distracted by its own assumed failures. Instead of actually fixing the problem, it starts debating its previous mistakes.
  • It grabs old, broken ideas: As the conversation drags on, the model starts pulling flawed variables and old logic from earlier in the chat, completely missing the actual current state of the system.

To bypass this bottleneck, stop treating the context window as a dumping ground and begin treating it as a specially curated working memory. The Sequential Log Analysis Protocol (SLAP) is a deterministic framework that forces an LLM agent to analyze massive logs without triggering context collapse.

Technical Foundation: Iterative State Tracking

The core philosophy of this protocol relies on offloading state bloat from the active conversation history into the filesystem. By pairing the source log file with two external Markdown tracking files—scratchpad.md and analysis.md—we externalize the model's long-term memory.

The chat window is actually a small (or smaller) memory with less details to follow making the reasoning engine's job easier. The files act as a stable, durable storage layer, allowing debugging sessions to pause, resume, or transition across fresh context windows without losing analytical state.


The System Prompt: Rules of Engagement

To execute this workflow, seed a completely fresh chat session with the following operational framework. Provide the log filename only.

# Debugging Protocol: Sequential Log Analysis

This is a log analysis workflow. Your role is to help the developer understand the provided log and point out when the log diverges from expected flows and results.

## Setup
* **Provided Log File:** The log file is very large. You MUST read it in 100-line chunks. If you read more than that, your attention will degrade which may lead to context rot, avoid it!
* `scratchpad.md`: A scratchpad for references you read and things you've learned so far about the log, flows, data, and anything else which might help you pick up where you left off last time. If the file does not exist, create it.
* `analysis.md`: A progression report. If the file does not exist, create it.
* **Initial Action:** Extract basic information from the first few lines of the log: what is being logged and executed, and anything that will help you determine what you're looking at.

## Tracking Rules
* The log most likely contains one or more components. Establish which components are being used, their IDs, their roles, and how to distinguish between them. Every time you learn about a new component/ID, document it immediately.
* If the log contains data, decode it and maintain a running state of what goes where and how it is being processed.
* If reading 100 lines drops you in the middle of a flow or a data chunk, or if you think the next 100 lines contain what you need to diagnose the current chunk, you may read exactly one additional chunk, but no more.

## Execution Loop
Move through the log in increments of **100 lines**. For each chunk, perform the following steps sequentially:

1. **Read & Map:** Read the current chunk (lines N to N+100).
2. **Verify:** Cross-reference each log event against expected behavior and the current data in `scratchpad.md`.
3. **Annotate:** If an event deviates from expected behavior, stop immediately. Append an entry to `analysis.md` describing:
   * The specific log line(s).
   * Why it is flagged (e.g., state mismatch, missing heartbeat, invalid sequence, etc.).
   * The evidence found in `scratchpad.md`.
4. **Pause:** Wait for user input. Do not proceed until the user confirms your findings, provides a counter-hypothesis, or explicitly instructs you to continue.
5. **Iterate:** If the chunk is "clean," update `analysis.md` with the phrase: *"Lines N to N+100 verified as nominal,"* and proceed to the next chunk.

## Communication Rules
* **Evidence-First:** Never state a bug exists without citing the exact log line and the specific requirement or code flow it violates.
* **Hypothesis Testing:** If you suspect a bug, you must propose an alternative hypothesis that might explain the log entry without it being a system failure.

Actionable Outcomes for Practitioners

By applying this protocol to your system, you will cleanly step past the context limits that cause catastrophic token fragmentation and code duplication.

  • Isolation of Code and Diagnostics: By forcing the LLM to analyze the log first using a 100-line sliding window, the root error is pinpointed while the context stays fresh and unencumbered.
  • Elimination of Flailing: The Dual-Hypothesis matrix forces the model to justify its assumptions using exact line citations, completely stopping it from chasing phantom bugs down hallucinated rabbit holes.
  • The 5-Line Resolution: When the context is full, the LLM attempts to do too much with too much data, causing it to get confused and struggle to sort the good data from the noise. By keeping the context pristine, the agent can effortlessly isolate the signal. The resulting fix becomes immediate, precise, and minimal-such as a simple 5-line idempotency check.

Adaptations and Troubleshooting

While this linear loop handles most standard debugging scenarios smoothly, highly variable production environments occasionally require context adjustments. Use these 4 tweaks to adapt the workflow to your specific needs:

  • Window Size - Are your flows longer than 100 lines? Shorter? Modify the number of lines it reads to try and fit an entire flow element into one or two reads.
  • Context Degradation - Is the agent ignoring the workflow or looping? Start a fresh session, tell it exactly which line you left off on, and keep going.
  • Incomplete Analysis - Is the agent detecting an issue but failing to pinpoint it? Don't let it rummage through the codebase and bloat the context. Use a subagent to do the heavy lifting for that specific issue. Once it finds the answer, it throws away the subagent's messy context and bring only the final conclusion back to your main thread.
  • Write a New Test - Stuck on how to fix it? Ask the agent to plan a test that executes this exact broken use case first. This keeps the context focused and makes the final fix regression-proof.

References

Tags:

Thursday, January 12, 2023

Visualizing Embedded System Behavior with Perfetto

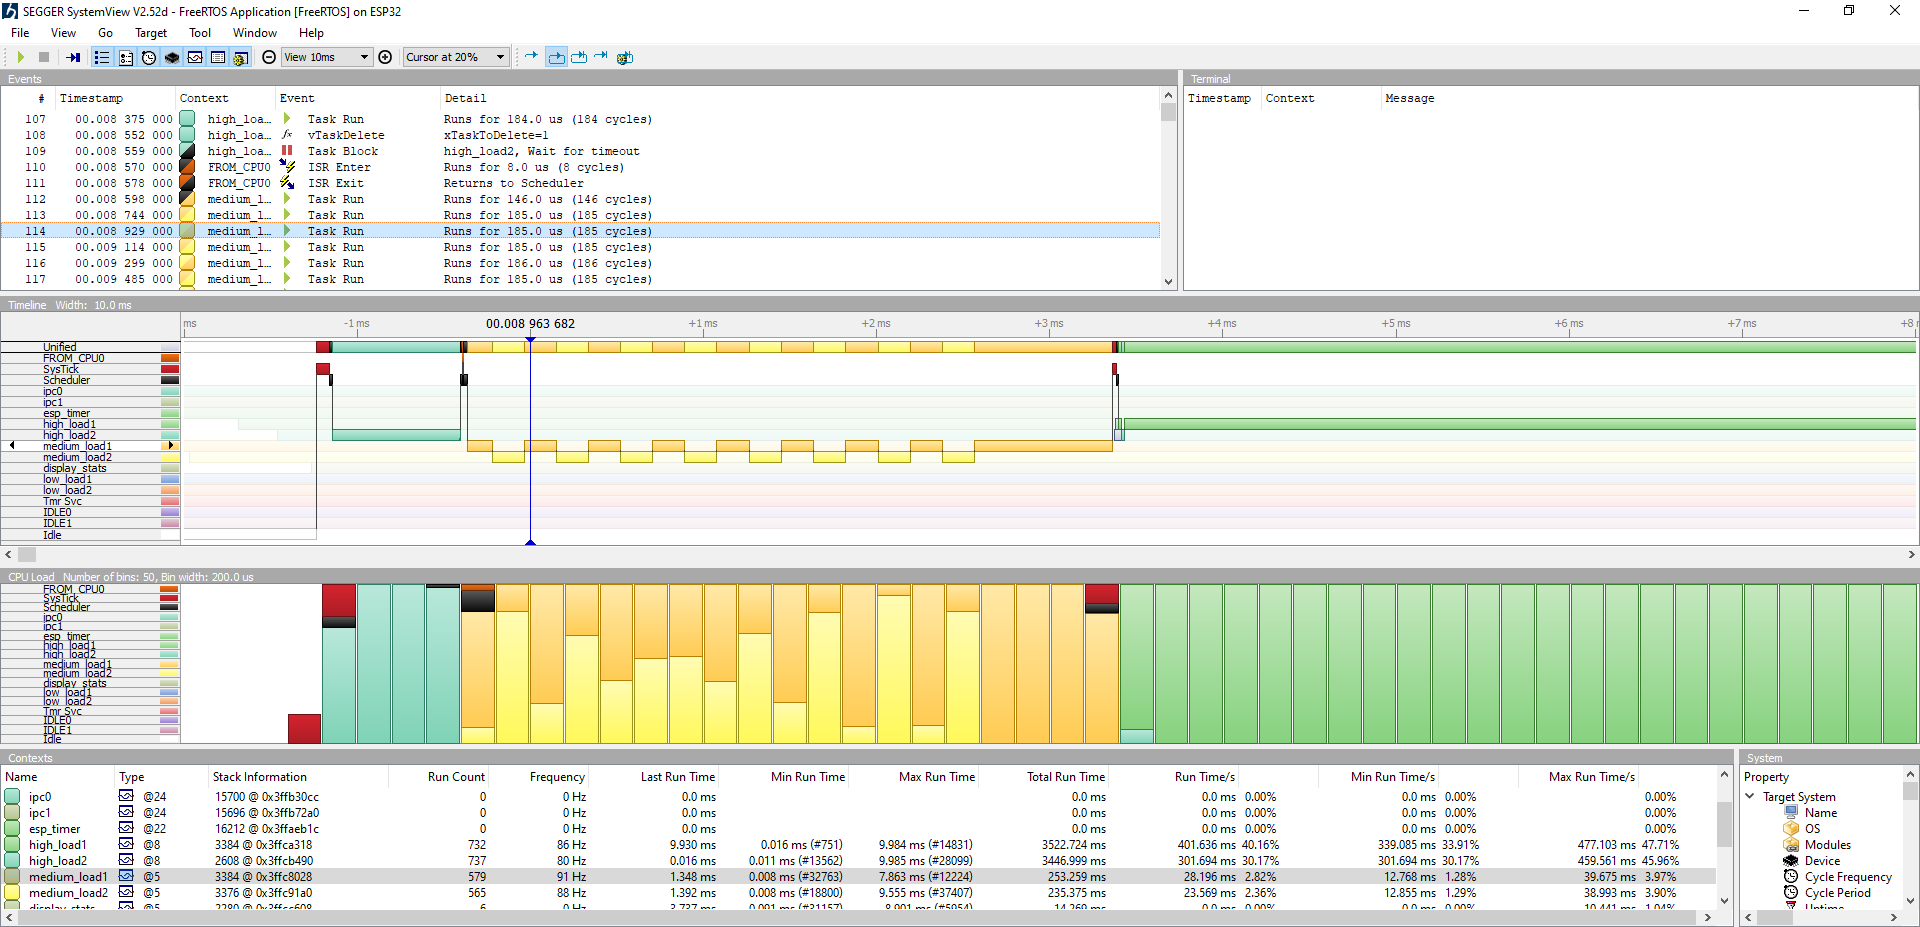
Segger SystemView and Percepio Tracealyzer have been the de-facto standard for visualizing embedded system behavior for the past few years, While Segger has been able to only visualize a single core, Percepio pricing is prohibitive to the hobbyist, last but not least is the toem Impulse which requires eclipse and some people have an aversion to that as well.


Perfetto

Perfetto is a System profiling, app tracing and trace analysis tool, it is open source and available as an online app, further more, its designed to handle millions of events, have SQL query, visual metrics and can handle multiple cores with no problem. Sounds like a perfect tool for the job no?

However, it was designed to visualize chrome and linux kernel (ftrace) traces and unfurtunately no support for the standardized SystemView file format. But how complicated is that format?

Apparently Espressif wrote a SystemView decoder and Perfetto wrote the protobuf files for ftrace, so its just a matter of mapping between them.

Example

This example is taken from sample 3 in the converter I wrote.


SystemView with Example 3


Perfetto with Example 3


As always you can find the fruits of my labor at my GitHub account.


Tags: , , , , ,

Wednesday, December 28, 2022

ESP32 Performance Profiling

The ESP32 is very capable but even the most capable of devices can get overwhelmed when using it extensively, so how can we find out what is taking so long or which function should we optimize to make things even better?


FreeRTOS Real Time Stats

FreeRTOS has a function vTaskGetRunTimeStats which can get statistics for tasks runtime, however the API takes some performance away. So it needs to be enabled in the configuration CONFIG_FREERTOS_GENERATE_RUN_TIME_STATS.

The following is an example from esp-idf examples.

Getting real time stats over 100 ticks
| Task | Run Time | Percentage
| stats | 938 | 0%
| IDLE | 403920 | 20%
| IDLE | 242954 | 12%
| spin3 | 225340 | 11%
| spin5 | 225360 | 11%
| spin6 | 225344 | 11%
| spin1 | 225392 | 11%
| spin4 | 225392 | 11%
| spin2 | 225360 | 11%
| esp_timer | 0 | 0%
| ipc1 | 0 | 0%
| ipc0 | 0 | 0%
Real time stats obtained

While this can help you zone in the task that takes the most time it won't help you find the slowest function or stack trace.

So when analyzing a potential performance issue, I'd use it as the first step to finding the tasks that take unusual amount of the CPU time.

Profilers

There are 2 general types of profilers, sampling profilers and tracing profilers. Sampling profiles capture the state of the program every x. Tracing Profilers inject hooks which are executed before and after each function.

While its possible to run both on ESP32, I've encountered problems trying to use a tracing profiler on ESP32 on PlatformIO since it uses the same build_flags -pg for both the bootloader and the application and it causes issues with missing _mcount function.

That leaves the sampling profiler option still available. But how to determine which function is currently running?

We can do it in two ways:

1. Sample each FreeRTOS task, since the stack pointer can be accessed we can check each stack pointer for the current PC (Program Counter) and determine which function is currently running. 

2. Sample the currently executing function, this can be done with interrupts since the interrupts share the currently executing task stack all we need to do is skip the counter's functions and the rest of the stack belongs to the currently running task. Since we have two cores we need to do it for both cores.

I've chosen to go with option no. 2 since it tells me more about what is currently running.

ESP32 Semihosting Profiler

It works by sampling the entire call stack and keeping statistics on the number of times a function was seen in the call stack, it then sends that information to the host computer though semihosting file system.

Once the sampling is done, the raw samples are processed to get the function name and locate the source line and the results are displayed and callgrind file is generated.

prvIdleTask tasks.c:3973  -> esp_vApplicationIdleHook freertos_hooks.c:63 : 783 307926512 76424201
vPortTaskWrapper port.c:131 -> prvIdleTask tasks.c:3973  : 783 307926512 76424201
esp_vApplicationIdleHook freertos_hooks.c:63 -> cpu_ll_waiti cpu_ll.h:183 : 781 307926512 76424201
vPortTaskWrapper port.c:131 -> spin_task4 real_time_stats_example_main.c:163 : 206 70213898 30992208
vPortTaskWrapper port.c:131 -> spin_task1 real_time_stats_example_main.c:151 : 204 70204906 31215652
vPortTaskWrapper port.c:131 -> spin_task5 real_time_stats_example_main.c:167 : 202 86176568 34547921
vPortTaskWrapper port.c:131 -> spin_task2 real_time_stats_example_main.c:155 : 201 97310444 38941256
vPortTaskWrapper port.c:131 -> spin_task6 real_time_stats_example_main.c:171 : 201 89345478 35511218
vPortTaskWrapper port.c:131 -> spin_task3 real_time_stats_example_main.c:159 : 201 68584391 30480011
spin_task4 real_time_stats_example_main.c:163 -> spin_task real_time_stats_example_main.c:143 : 134 62236086 27673084
...


As always you can find the fruits of my labor at my GitHub account.


Tags: , , ,

Wednesday, November 30, 2022

Generic Gamepad for Toy Cars

Some kids love motorized toys, cars, trucks and basically anything that makes a noise or have a motor can be a child's toy.

I've been searching for a quick, simple, cheap, generic option to replace the remote controls with something I can easily source without building a specialized PCB or costing too much and I think I've found that option.

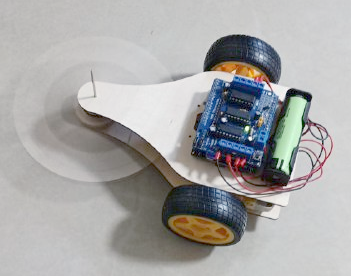
This is the battlebot I've been using it for, the original controller stopped working after 3 minutes.

Wemos D1 R32

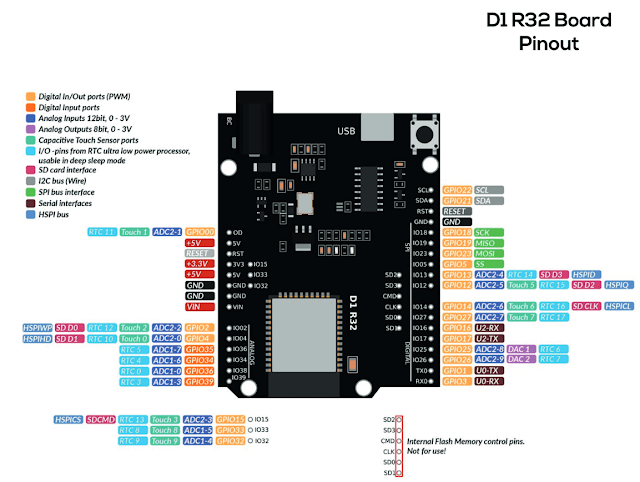
The Wemos D1 R32 is ESP32 in Arduino Uno form factor. The pinout is standard while still allowing access to all Arduino Uno standard pins and GPIO2 for onboard led. The schematics are available.


L293D Motor Control Shield

The motor shield was originally created by Adafruit but has since become ubiquitous through other online shops.


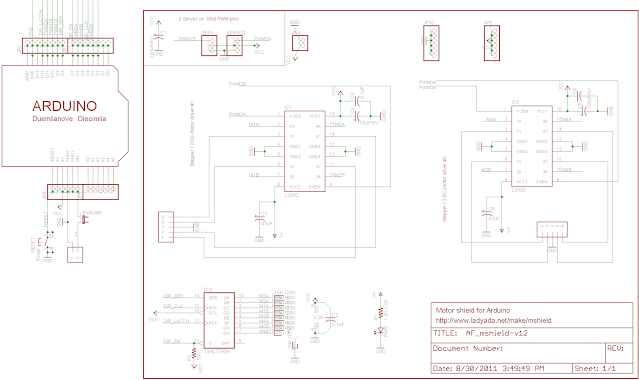
But it was designed to work with Arduino Uno so I had to go through the schematic to understand how the ESP32 should access it.


  DIR_SER - GPIO12
  PWM1A - GPIO13 - servo2
  PWM1B - GPIO5 - servo1
  PWM2A - GPIO23 - dc1
  DIR_LATCH - GPIO19
  DIR_EN - GPIO14
  PWM0A - GPIO27 - dc4
  PWM0B - GPIO16 - dc3
  DIR_CLK - GPIO17
  PWM2B - GPIO25 - dc2

Bluepad32

Bluepad32 was created by Ricardo Quesada, it was designed to to allow using newer gamepad controllers with retro gaming consoles.


While it has a long list of supported controllers, I've found that the DualShock 4 works best for me.

To pair the DualShock 4 to ESP32 you'll need to turn it on while pressing the "SHARE" button and PS Button.

Firmware

After mapping the pins between the ESP32 and the Motor Shield, I needed to write a new Bluepad32 platform, I've called mine uni_platform_motor. The new platform uses Adafruit's AFMotor to control the motors, but you can use anything else you'd like to control.

The uni platform has the following important events:
- on_init_complete - which fires when the platform is initialized
- on_device_connected - where you can do motor arming 
- on_device_disconnected - where you can do motor disarming, stopping the engines etc'
on_gamepad_data - where you can process incoming joysticks and buttons processing and convert it into motors commands.

Porting AFMotor

The AFMotor was not designed for ESP32 and I did a very crude job of porting it since it was just to see if they can work together and it was good enough.
Please note that the Motor Driver uses a few pins that might not be mapped to GPIO, (for example: pin 14), to use these pins its not enough to use the gpio_set_direction, but rather you should use the more generic gpio_config.

Motor Direction Algorithm


Summary

The proposed solution enables relatively cheap components to be bound to a single remote and so I don't have to disassemble the controller or build my own. 
Also, thinking about the future, it can be used for scratch or Arduino development with the same hardware so another one for the pros list.

Lastly, The DualShock4 can be used with other game consoles, PCs, TV Stocks etc' therefore future proofing the whole expense.

I would like to express my gratitude again to Ricardo Quesada for making the Bluepad32.

As always you can find the fruits of my labor at my GitHub account.


Tags: , , ,

Wednesday, November 23, 2022

Embedding Lua in your Projects

Lua is lighweight programing language designed for embedding, it was created in 1993 by Roberto Ierusalimschy, Luiz Henrique de Figueiredo, and Waldemar Celes.

Lua even has a very fast LuaJIT which sadly I cannot use since I'm aiming for embedded MCU.


Fortunately, Lua has great documentation and huge community, while the language needs some getting used it, it can do everything I need and more and embedding it was by far the fastest from previous MicroPython and QuickJS.

Installation of the Lua library was very simple, download the release, extract it in the lib folder and add library.json.

To gain the performance I needed, I've modified luaconf.h

1
2
3
/* Default configuration ('long long' and 'double', for 64-bit Lua) */
#define LUA_INT_DEFAULT		LUA_INT_INT
#define LUA_FLOAT_DEFAULT	LUA_FLOAT_FLOAT

To initialize Lua a new state is created and the default libraries added to it

1
2
3
4
5
6
7
8
9
lua_State *L = luaL_newstate(); /* create state */
if (L == NULL)
{
    l_message(argv[0], "cannot create state: not enough memory");
    return EXIT_FAILURE;
}

printf("setting libs\r\n");
luaL_openlibs(L);

Next is injecting the demo function into the state

1
2
3
function transform(a,b)
    return (a^2/math.sin(2*math.pi/b))-(a/2)
end

 1
 2
 3
 4
 5
 6
 7
 8
 9
10
11
12
char *code = "function transform(a,b)\r\n \
return (a^2/math.sin(2*math.pi/b))-(a/2)\r\n \
end\r\n";

if (luaL_loadstring(L, code) == LUA_OK)
{
    if (lua_pcall(L, 0, 0, 0) == LUA_OK)
    {
        // If it was executed successfully we remove the code from the stack
        lua_pop(L, lua_gettop(L));
    }
}

And to run the transform function, the function name is pushed along with its arguments, the function is called and the result is pulled back from the stack

1
2
3
4
5
6
lua_getglobal(L, "transform");
lua_pushnumber(L, i);
lua_call(L, 2, 1);

double res = lua_tonumber(L, -1);

Summary

Lua was the easiest to integrate, it is the fastest scripting engine and if speed is your primary concern it should be one of the top candidates.

In my particular use case:
  • x64 native vs Lua slow down is about 4x times
  • ESP32 native vs Lua slow down is about 20x times


As always you can find the fruits of my labor at my GitHub account.


Tags: ,

Embedding QuickJS in your Projects

QuickJS is small and embeddable Javascript engine made by the famous Fabrice Bellard, it supports ES2020 specifications and made available under MIT license.

You might have read about my porting of his TinyEMU to ESP32 which could boot linux.


During my hunt for scripting engine that can be integrated into a new embedded product I've encountered MicroPython and QuickJS, while the documentation is a bit lacking, the code was much easier to read and compile, there are no complicated build scripts and it was basically dropping the last version in the lib folder and selecting which files should be compiled with library.json

Once the library was compiled, integrating it into my demo was very easy and supporting multiple execution contexts is very easy since its not sharing context and variables.

 1
 2
 3
 4
 5
 6
 7
 8
 9
10
11
12
13
14
JSRuntime *rt = JS_NewRuntime();
if (!rt)
{
    fprintf(stderr, "qjs: cannot allocate JS runtime\n");
}

JS_SetMemoryLimit(rt, 80 * 1024);
JS_SetMaxStackSize(rt, 10 * 1024);

JSContext *ctx = JS_NewContext(rt);
if (!ctx)
{
    fprintf(stderr, "qjs: cannot allocate JS context\n");
}

The JSRuntime object represents the JavaScript engine, its responsible for memory allocation and C function calls. 

The JSContext object respresents the execution context where JavaScript functions and variables live.

Our demo workload

1
2
3
function transform(a, b) { 
    return (a ^ 2 / Math.sin(2 * Math.PI / b)) - a / 2; 
}

We'll eval(uate) the function to get it into the context

1
2
3
4
5
6
const char *expr = "function transform(a,b){return  (a^2/Math.sin(2*Math.PI/b))-a/2;}";
JSValue r = JS_Eval(ctx, expr, strlen(expr), "", 0);
if (JS_IsException(r))
{
    printf("Error evaluating script\r\n");
}

And once we have the function in the context, we can get it by name and execute it with the a and b arguments

 1
 2
 3
 4
 5
 6
 7
 8
 9
10
11
12
13
14
15
16
17
18
19
JSValue args[2];
args[0] = JS_NewFloat64(ctx, (double)i);
args[1] = JS_NewFloat64(ctx, (double)i);
JSValue res = JS_Call(ctx, func, global, 2, args);
if (JS_IsException(res))
{
    printf("Error Executing transform\r\n");
}

if (!JS_IsNumber(res))
{
    printf("is not number!\r\n");
}

double result;
if (JS_ToFloat64(ctx, &result, res))
{
    printf("error parsing number\r\n");
}

Summary

QuickJS looks very interesting as a JavaScript runtime engine, its relatively fast and the code seems self explanatory. It has been embedded in rust, as an isolated VM in Node JS and more.

While QuickJS is different from MicroPython, its faster to execute the same workload, it was more readable for me and faster to setup and compile, one of the major drawbacks is that if you want to use it as an alternative to MicroPython, you'll need to implement your own hardware drivers for SPI, I2C etc'.

You may find Carlos Alberto's Writing native modules in C for QuickJS engine useful.

Lastly, I've attempted to modify QuickJS to use floats instead of double since ESP32 FPU is single precision only, it will probably make it non-standard and fail many JavaScript standard tests but I've included it here anyway.

In my particular use case:

  • x64 native vs QuickJS slowdown is about x9 times
  • ESP32 native vs QuickJS slowdown is about x63 times
  • ESP32 native vs QuickJS using float slowdown is about x25 times

You may view the official benchmarks here.

As always you can find the fruits of my labor at my GitHub account.


Tags: , , , ,