


Segger SystemView and Percepio Tracealyzer have been the de-facto standard for visualizing embedded system behavior for the past few years, While Segger has been able to only visualize a single core, Percepio pricing is prohibitive to the hobbyist, last but not least is the toem Impulse which requires eclipse and some people have an aversion to that as well.

Perfetto
Perfetto is a System profiling, app tracing and trace analysis tool, it is open source and available as an online app, further more, its designed to handle millions of events, have SQL query, visual metrics and can handle multiple cores with no problem. Sounds like a perfect tool for the job no?
However, it was designed to visualize chrome and linux kernel (ftrace) traces and unfurtunately no support for the standardized SystemView file format. But how complicated is that format?
Apparently Espressif wrote a SystemView decoder and Perfetto wrote the protobuf files for ftrace, so its just a matter of mapping between them.
Example
This example is taken from sample 3 in the converter I wrote.
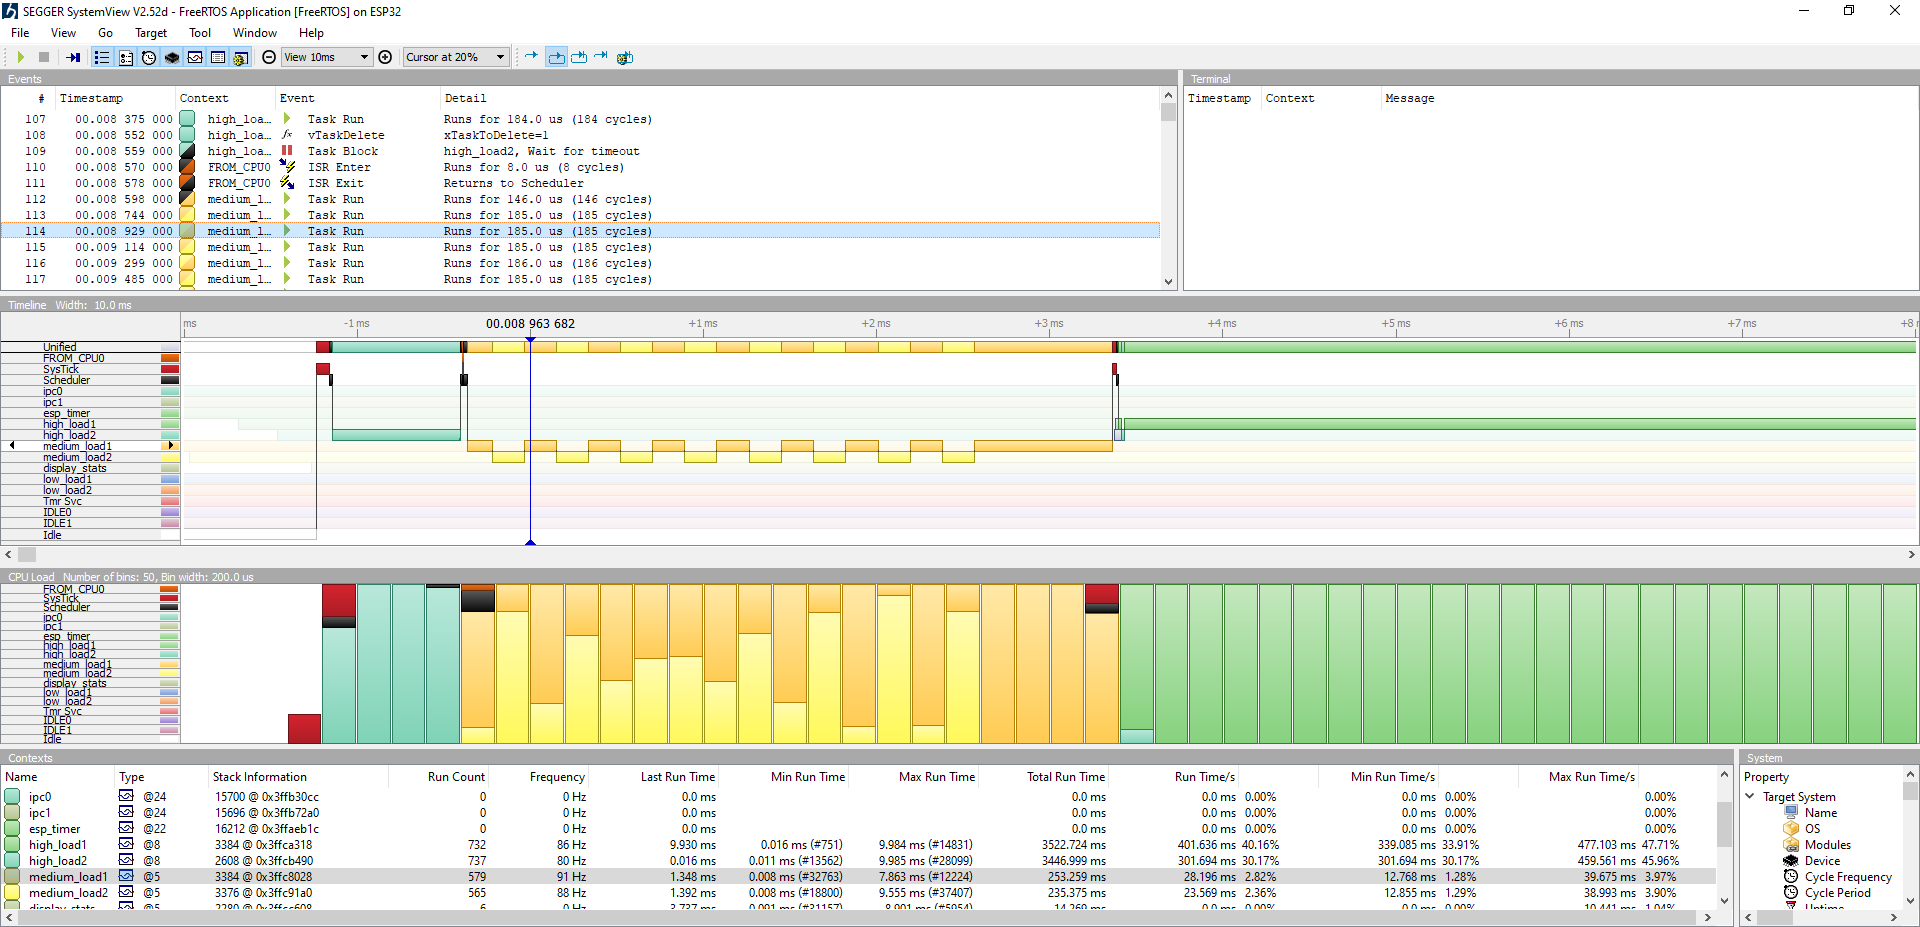 |
| SystemView with Example 3 |
 |
| Perfetto with Example 3 |
As always you can find the fruits of my labor at my GitHub account.