If you read any of my previous articles you could probably guess I'm not a big fan of debugging. I truly believe that production should not be debugged (with exceptions) and therefore, its better to change one's thought process and build beneficial logging abilities.
But probably the most widely used debugging 'technology' is the printf way, by locating the crash or stack trace, the magical printf can tell us the current state which lead to the bug or crash and we can fix it. If we're thorough, we'll probably add a unit test to avoid that bug in the future.
As much as I would like it to be, in embedded systems, logging is not always realistic, it can affect timing, occupy UARTS and kill eMMC.
So what are our other options?
Sometimes the we only need an indication something is not happening, an "if" statement we're not sure is actually happening, how about using a GPIO to turn a led on?
Two more relatively fast options are I²C and SPI, we can use a very simple program that dumps the values being sent.
To further improve the logging abilities of these facilities, you can encode only the values, rather than a text log message.
Debugging Port
JTAG has been around for quite some time (1990!), these days most MCUs have a debugging port, be it JTAG, SWD or debugWire (AVR).
JTAG in particular is very capable, its designed to be chained across all the chips, processors and DSPs on the board, so a single port can be used to debug many components.
Logging
While printf debugging can provide a short term or a localized debugging option, as developers, we need to consider longer term and production problem solving and these solutions either keep state changes in a log file by either saving rolling logs or by having some sort of circular buffer of logging messages.While logging is pretty straight forward implementation, the ESP32 logging facilities provides a few interesting points:
1. logs are divided by TAGs
2. logs can be turned off/on/set logging level by each tag
3. internal esp-idf components also have a log tag
4. printf is always sent to UART0
5. logs can be captured, this is one of the more interesting features since it allows you, as a developer to have a device in the field that is misbehaving and you can turn on logging remotely and ask for the log files.
While not directly related to logging, the ESP32 and FreeRTOS provides a few more interesting mechanisms for debugging problems:
1. get reset reason, this is very important, think of it as extra information you can write to your logs when the device starts, did it reboot because of power failure? brownout? watchdog?
2. Core Dump, when the device in the field, who is going to monitor the stack trace? it cannot be written to the log file, nothing is usually monitoring the UARTs, so where does it go? you can configure a core dump to place it on the flash, so next time you're asking for logs, you can also retrieve the core dump and analyze it.
3. FreeRTOS Memory Analysis, heap corruption, maximum stack use, maximum heap use and even memory tracing similar to crtdbg.
4. FreeRTOS CPU Utilization
PlatformIO Unified Debugging
PlatformIO became my favorite development platform, its simplistic, near zero configuration and simple extensibility gives one ability to do almost anything with very little effort.In ESP32 case, the openocd-esp32 and esp-idf are integrated with its unified debugger, making it so simple, I just had to add one line to platformio.ini:
debug_tool = esp-prog
or
debug_tool = jlink
But that will only get you so far, if you start the debugger, the esp32 debugging configuration is missing, so you'll need to add a debug env as well with build flags to add debug symbols to the firmware:
build_flags = -ggdb
JTAG
JTAG is a standard debugging port, its common with most of the modern systems, it can help you to physically test a board using Boundary Scan, Stop and Start CPU cores, read and write variables and memory, add breakpoints, read and write registers, execute code and commands and even write firmware.Unfortunately ESP32 does not provide boundary scan capabilities, but you can achieve that and more if you have your test fixture flash MicroPython, script logic analyzer commands and analyze the results.
 |
| source |
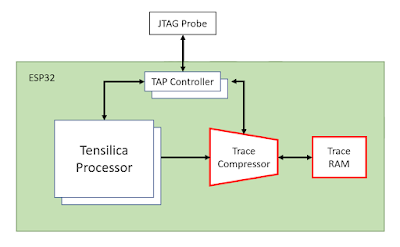
The rest of the features JTAG is enabling are great and on top of that the Tensilica TRAX module enhances debugging facilities by adding real-time log tracing and even FreeRTOS event tracing.
So what is TRAX?
TRAX is TRace Analyzer for Xtensa, is a module that the CPU and JTAG share to transfer data between the host and Tensilica Processor.With that in mind, we can use that data for almost anything, Espressif provided us with two interesting examples, trace logs and FreeRTOS events, but the sky is the limit.
Getting Started
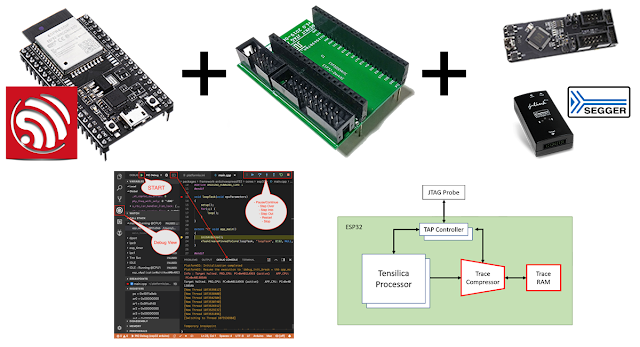
This is the ESP32-DevKitC, it's one of the most popular ESP32 development kits, its a low-footprint board with the essentials, it comes with either WROOM or WROVER modules. Its drawback is the lack of JTAG connectors, but you can add it by wiring directly to the pins. |
| source |
 |
| Get yours here |
On the other hand, this adapter exposes the JTAG pins in both 10pin esp-prog format and 20pin standard JTAG / Segger J-Link format, it can stack between the DevKit and your breadboard or development PCB, it made me a lot less lazy connecting the debugger, is it a positive or a negative thing, you decide.
In the end of this article you can find other options from Espressif.
As a side note, I've experienced different problems with different debuggers, the Segger J-Link would freeze every once in a while, needing a complete disconnect and power down of both the debugger and devkit, the FT2232 based debuggers would succeed to upload the sketch through the J-Link interface but it was an inconsistent experience.
So how to debug?
1. compile and upload the firmware using -ggdb flag.
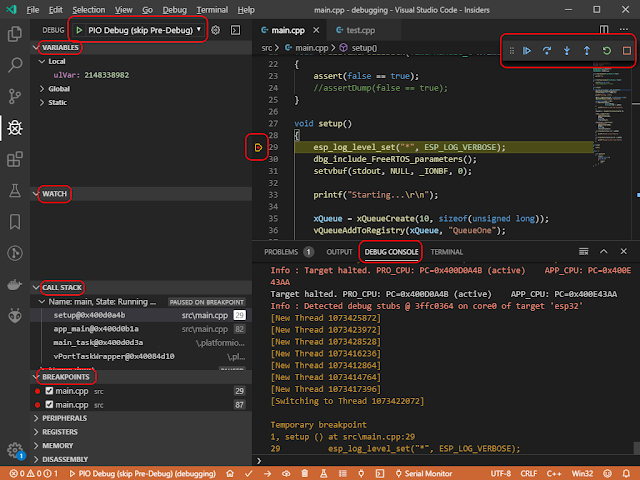
2. in VSCode, go to Debug View, click PIO Debug (skip Pre-Debug), wait about 10-20 seconds and your first breakpoint will be caught.
We have a few interesting points here.
1. The top left PIO Debug will start the debugger, you should switch to the lower right debug console tab to see progress and execute debugger commands.
2. Debugger specific sidebar where Variables, Watch, Call Stack, Breakpoints etc' are visible.
3. The gutter in the editor can set a breakpoint or conditional breakpoint, please note that since conditional breakpoint is implemented in the debugger, the execution will be paused each time the breakpoint is hit and evaluated, this affects timing and performance.
4. Top right bar shows debugger controls, Continue, Step Over, Step In, etc', Note that they might not work if no hardware breakpoint is available.
The Debug Console view in VSCode exposes GDB, I'm saving it for my next article, its going to be about ESP32 log tracing and event tracing abilities, exciting!
Debugging Supported ESP32 Development Kits
1. ESP-WROVER-KIT - JTAG on board (using FT2232HL chip)ESP-WROVER-KIT-VB is a highly integrated ultra-low-power development board which includes Flash and PSRAM with dual-core 240 MHz CPU.
Create Internet cameras, smart displays or Internet radios by connecting LCDs, microphones and codecs to it.
 |
| source |
2. ESP32-LyraTD-MSC - JTAG connector
Designed for smart speakers and AI applications. Supports Acoustic Echo Cancellation (AEC), Automatic Speech Recognition (ASR), Wake-up Interrupt and Voice Interaction.
 |
| source |
3. ESP32-Ethernet-Kit - JTAG on board (using FT2232HL chip)
Consists of two development boards, the Ethernet board A and the PoE board B
 |
| source |


