


Like static code analysis, dynamic code analysis provides another level of coding errors detection and can help diagnose memory access issues such as use-after-free or uninitialized read and even memory leaks and memory write overruns.
 |
| source |
On top of that, we can write every line of code that has been used and later correlate that and say which lines were executed and which were not and that is the essence of code coverage.
Code Coverage
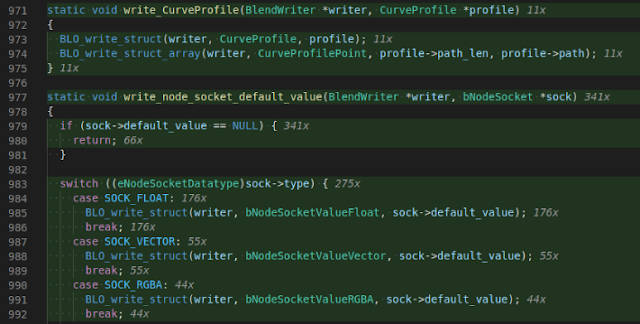
A unit test is just code that executes your code, by executing your code and providing it with information it needs and checking its return values and side effects we can determine if your code does what it was designed to do.
Running unit tests is usually done by creating another executable or firmware that runs all your tests one by one and reports their status.
Eventually, if this executable writes which lines were executed, a reporting tool can later read that data and cross reference it with the source code to produce statistics and reports.
To make it work, we need to disable optimizations and compile debug symbols, otherwise we'll get bad results if any.
So first, we'll add the required flags to our environment in platformio.ini:
build_flags = -ggdb -lgcov -O0 --coverage
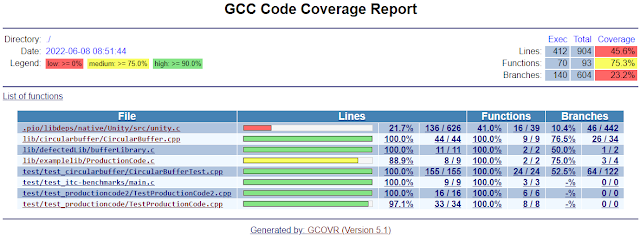
Now when we run tests, the coverage data will be written into the gcda and gcno files we can view it with a VSCode Extension directly:
But it might not be enough, we can also view it in command line or even in CI so well need to build a report from it, we'll use gcovr do build a tracefile from it and since we have more than one test module, we'll want to merge all the tracefiles to a single report.
Lets start by adding our runner to platformio.ini:
extra_scripts =
    scripts/run_gcovr.py
The runner hooks into the test executable generation and executes gcovr and generate a tracefile for each test executable.
When the tests are done, we can get the coverage info by running:
pio run -t gcovr
We can then browse the .reports/coverage.html
If you have other requirements from gcovr, there are many options for the output and you can use a configuration file to specify what you need.
Dr. Memory
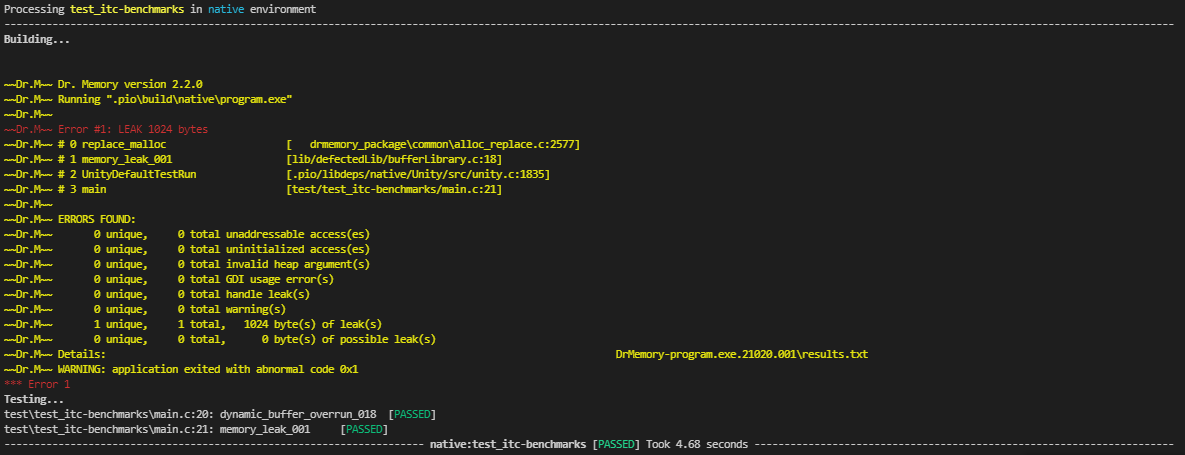
By hooking into the PlatformIO testing mechanism and intercepting the compiled tests we can execute the tests under Dr. Memory's supervision and get a report of where exactly code was leaking or accessing memory it wasn't supposed to, it does require the developer to not leave dangling memory after tests so each malloc will need to be matched with free and every new will have to be delete(ed).
This step does not require any intervention from the user other than add run_drmemory.py to extra_scripts:
extra_scripts =
    scripts/run_drmemory.py
Just note that Dr. Memory can do more than that, so its good to explore it further.
0 comments:
Post a Comment